Visualising Tree Data with ETE Toolkit (EN)

The world is very complex. Things are related in all kinds of different ways — some relations are intuitive, some aren’t. As a result, the data that we collect and use to describe the world comes in all kinds of shapes and sizes.
In addition, Data Visualisation is one of the most important aspects of the data analysis process. Good visualisation is critical in helping clients and stakeholders understand data.
In combination, these two points mean that people who work with data need to be prepared to represent it in ways that best illustrate the relationships between data points — and what it might mean for action. Today, we’re going to look at one such representation and a tool you can use to create it.
Trees as a data structure
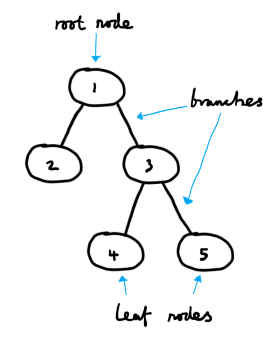
At work, I recently came into contact with trees. A tree is a way of representing a set of hierarchical data. The relations between instances in a tree are fairly intuitive to understand, thanks to the ready analogy with the botanical trees that we are all familiar with. The ideas of roots, leaves and branches transfer over quite well when we are talking about the data structure rather than the perennial plant.
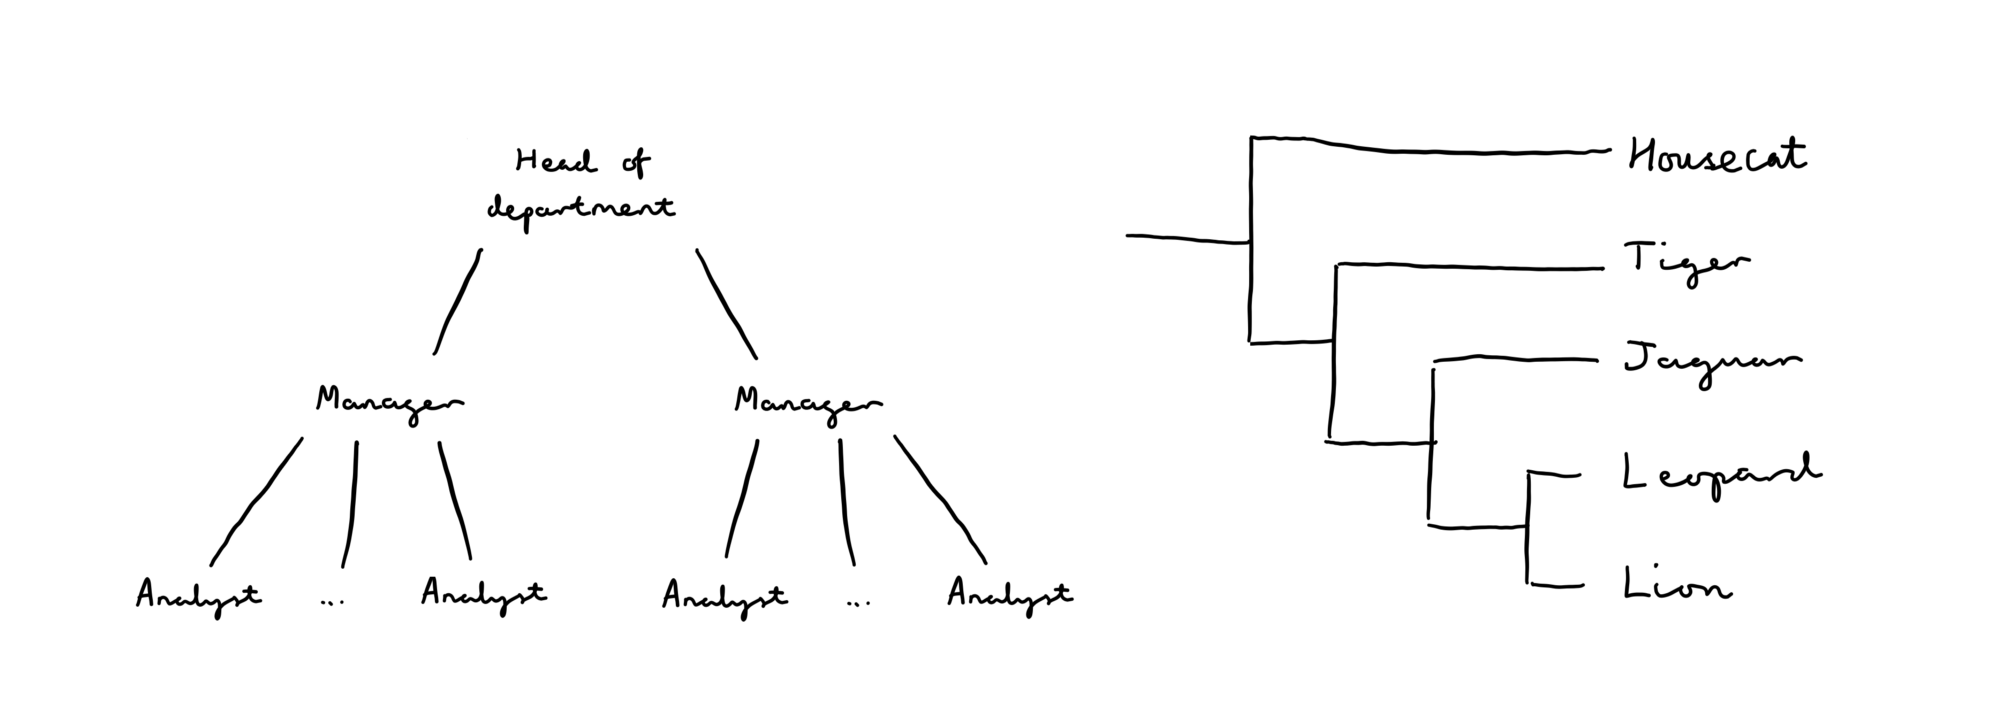
Trees and hierarchies are found all over the place — common real-world examples are company structures and evolutionary trees.
As you can see, it’s relatively easy to sketch out a tree for a given set of hierarchically linked data. But what about when you have large amounts of data, or your data is constantly evolving? Redrawing the whole thing by hand is painstaking and time-consuming…
ETE Toolkit
…And that’s where ETE Toolkit comes in. This is a Python library for the analysis and visualisation of trees. It was originally developed by the bioinformatics department at the Principe Felipe Research Center in Valencia, Spain, so it’s capable of all kinds of scientific analysis. It’s also a handy way to automate the visualisation of any tree data structure, the basics of which I’m going to describe here. Check out ETE Toolkit’s Gallery to see some of the package’s more advanced features.
Visualising a customer referral system
Let’s use a customer referral system as an example. You’re probably familiar with how this works — a customer who purchases a product is given a unique code that they can share with their friends. If one of their friends decides to also purchase the product and quotes this unique code when doing so, both earn a reward. It’s a win-win scenario — the company selling the product is able to align the customer’s interests with its own by incentivising them to spread the word and encourage more people to become customers — and of course, the customers themselves enjoy a discount.
Say each customer is allowed to refer up to 5 people. Say also that we currently have a tabular representation of this data as follows:
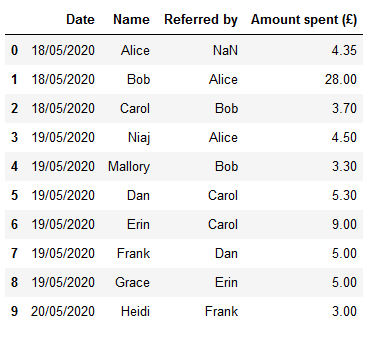
We have data on a number of purchases, including:
- date of transaction;
- name of customer;
- who referred the customer; and
- how much they spent.
This data forms a hierarchy — each customer can be represented as a node in a tree diagram, with the person who referred them placed above them in the tree, and the people they went on to refer branching off below them. We can also see here that Alice is the “original” customer that has started this particular chain of referrals — that is, Alice is the only customer who was not referred by someone else. This makes her the root customer.
Given this, we could draw a tree diagram by hand — going through each customer in turn, working out who should be linked to them in the tree, and adding the appropriate as children, branching off underneath them. But why do that when ETE will gladly to do the hard work for us?
ETE takes input in Newick format — a relatively standard way of compactly describing the layout of tree structures in mathematics and science. Here’s a couple of examples:
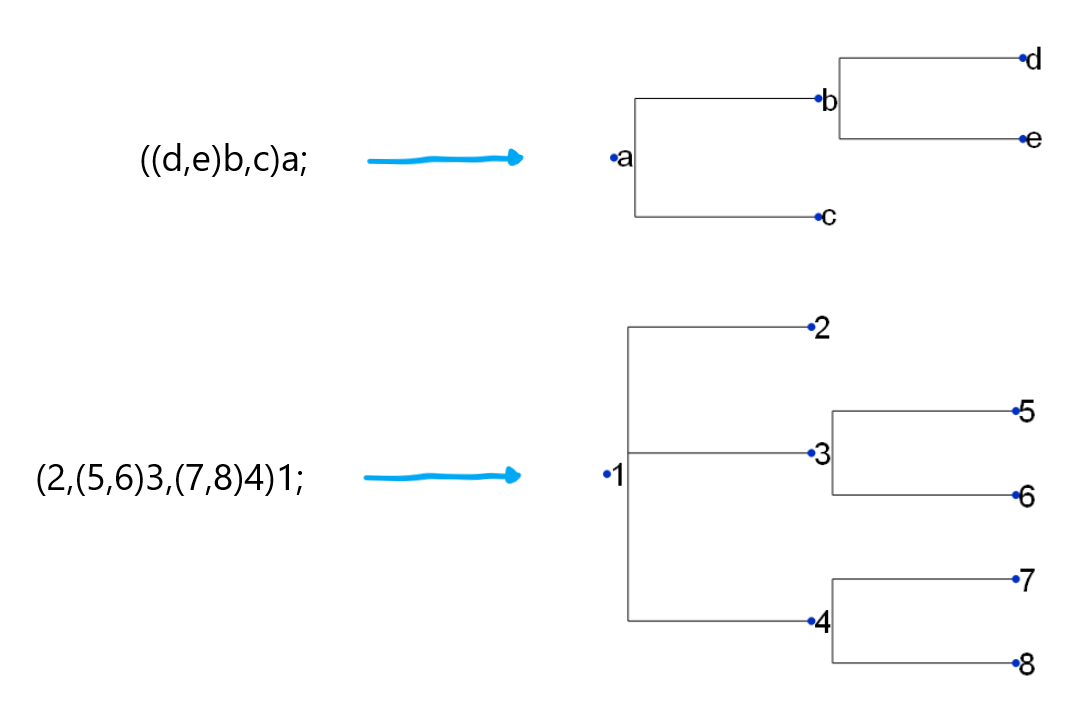
You may be able to notice that a set of branches is represented by a pair of parentheses. The number of branches coming off of a given node is determined by the presence of commas within the parentheses. And of course, pairs of parentheses can be nested to produce more and more complex structures.
I’m not going to spend too long on the details of Newick format — it’s sufficient to know that we can tell ETE what we want to visualise by converting our data into this format. I’ve written some code to do this for us, which I won’t describe here — if you’re interested, take a look at the Jupyter Notebook on GitHub that goes with this post for more information.
Our customer data can thus be written in Newick format as follows:

Let’s see what we get when we feed it into ETE:
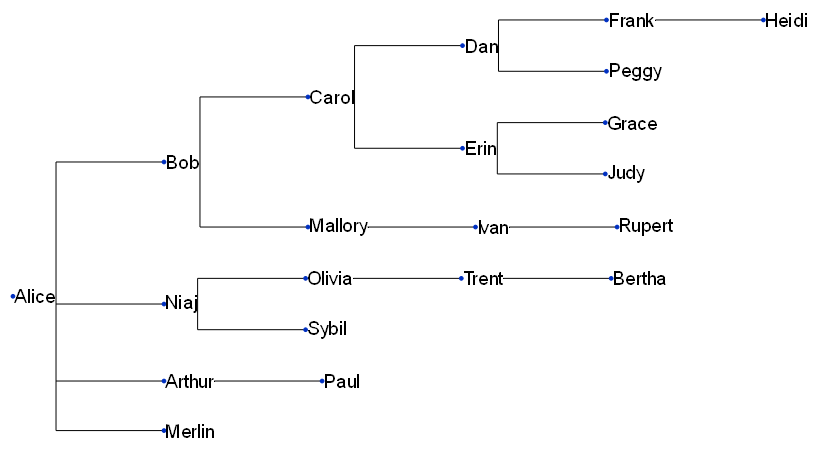
Not too bad! Looking quite basic at the moment — but ETE has taken a lot of the complexity out of the visualisation process. What’s more, we can simply re-run our code whenever we get updated data!
Another advantage of ETE is that we can quite easily make adjustments to presentational aspects of the tree. Let’s see if we can make it look a bit snazzier…
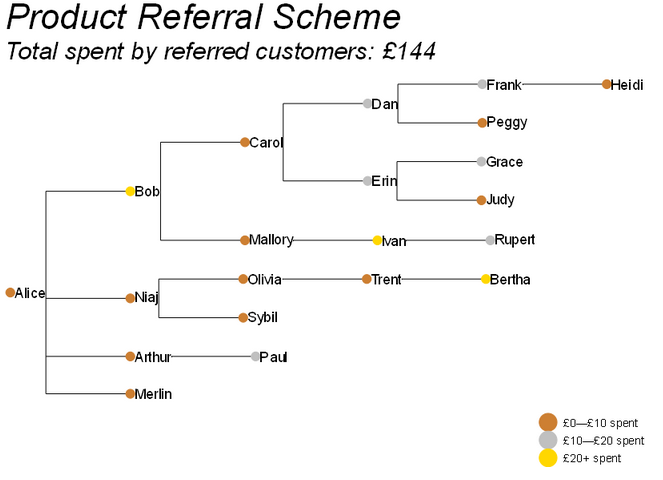
That’s better. We’re still just scratching the surface of what ETE Toolkit is capable of, but as a quick illustration, this is enough to get some of the key ideas across.
Conclusion
The human brain loves to hoover up visual information. Trees have a ready real-world analogy that makes them intuitive and easy to understand. This makes them a great tool for explaining data to non-specialists. And to make one final generalisation — the brain has a number of natural strengths and a number of natural weaknesses. We will always have an easier time digesting data when it is presented to us in a way that works with these peculiarities, rather than against them.
More info and credits
Andrew Hetherington is an actuary and data enthusiast working in London, UK. All views are Andrew’s own and not those of his employer.
- Connect with me on LinkedIn.
- See what I’m tinkering with on GitHub.
- The notebook used to produce the work in this article can be found here.
Tree photo by Todd Quackenbush on Unsplash.
ETE 3: Reconstruction, analysis and visualization of phylogenomic data.
Jaime Huerta-Cepas, Francois Serra and Peer Bork.
Mol Biol Evol 2016; doi: 10.1093/molbev/msw046