Using Maths to Rig Elections
Disclaimer: I do not condone using maths to rig elections! But for argument’s sake…
Imagine for a moment that you were not-so-morally upstanding of a person and that you were tasked with making up a set of numbers. You need to doctor these figures in such a way that they represent a favourable outcome, while also not attracting suspicion from anyone that might happen to look at them.
You decide to pick them randomly — or even better — to use a random number generator to remove any kind of unconscious bias that you might accidentally bring in. Snickering with unscrupulous glee, you replace the offending results with more appropriate ones. After destroying the evidence you go to bed that night, safe in the knowledge that there’s no possible way for you to get caught.
Unfortunately, I may have some news for you.
A disconcerting distribution
Our crooked conspirator above was right in thinking that their randomly selected numbers will be uniformly distributed, in that each outcome is equally likely, and hence patternless. However, they made a mistake: populations, street addresses, the figures appearing in the Financial Times, number of leaves on trees — any natural population of numbers — also obey a less intuitive rule that takes more work to fake.
To illustrate, let’s take the populations of the countries of the world, which range from a few thousand to over a billion. Now, let’s slice the leading digit off of all these numbers. Like so:
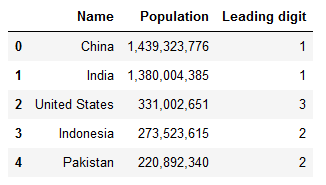
Here’s the important question: how do you think these leading digits will be distributed?
It might seem logical to think that no digit will occur more commonly than any of the others. Given that there are 9 possible digits, each one should come up about one-ninth of the time, right? Let’s see if this prediction is borne out in practice:
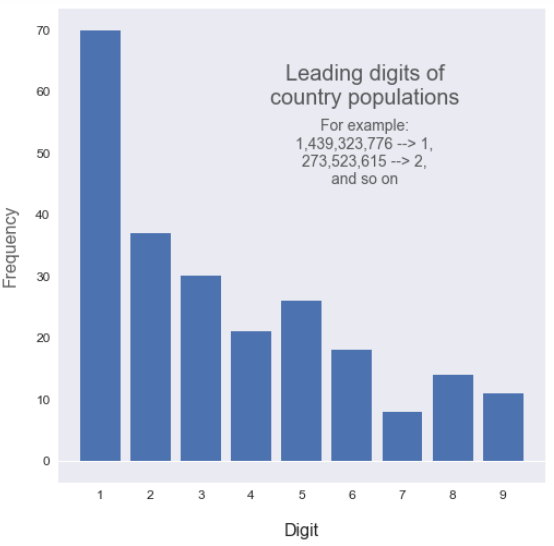
Now, that’s a bit of a surprise — the seemingly intuitive conclusion of equal likelihood is, in fact, completely wrong! And this pattern isn’t just observed in populations of people — you’ll find it in house prices, lengths of rivers, heights of buildings…
This phenomenon is called Benford’s Law and is to be found in any population that:
- is not artificially constrained; and
- spans a sufficient number of orders of magnitude.
Phone numbers are constrained to start with certain digits (area codes) violating the first point above. The number of washing machines in households does not tend to take a wide range of values, violating the second (sorry if I offend any collectors). The result is that these populations would not necessarily exhibit this behaviour.
Why on earth
To help you build a bit of an intuition for why this happens, let’s take an example. Consider a uniformly distributed population — the numbers from 1 to a certain upper limit — and observe how the probability that a randomly selected number begins with a certain digit varies as the population size is increased.
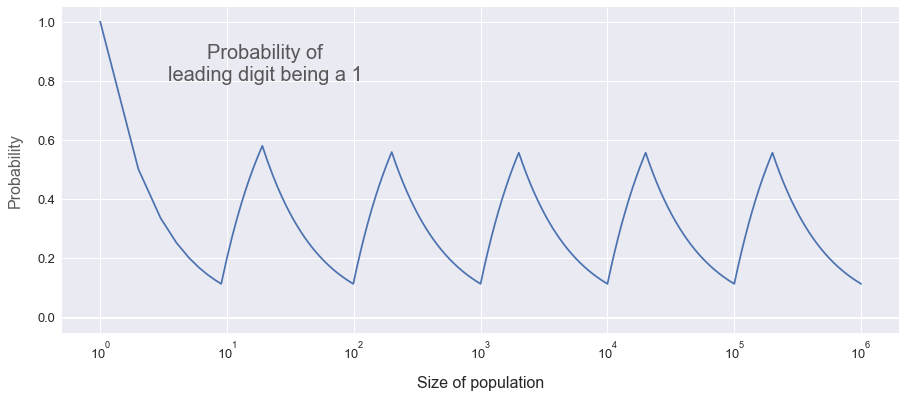
At the very left, the population is simply {1}, so the probability of picking a number with a leading digit of 1 is 100%. As the population grows in size, the probability of obtaining a leading digit of 1 decreases — until it reaches one-ninth, about 0.11, when the population size is 9 and there is one of each digit.
But then we start counting into the tens — and obtaining a leading 1 begins to become more likely again! The probability decreases as before as we count up to 99, where each leading digit is equally likely again — and then the pattern repeats.
We can observe that when the population size is 9, 99, 999, and so on, each leading digit is indeed equally likely. But for all other population sizes, you’re more likely to get a 1 than any other number. Neat!
Going back to our example of the populations of the world’s countries, there’s no pattern in the numbers — some countries are big, like India, and some are small, like Tuvalu. The population of a typical country will be somewhere between 0 and the population of the largest country (China, with 1.4 billion inhabitants) — and taking the population of a random country will basically like picking a number randomly from 1 to 1,400,000,000. If our graph above extended along to 1.4 billion, we would find that the probability of a leading 1 is 36.5%! In this range, there are more leading 1’s than 2’s, more leading 2’s than 3’s, and so on. This is why we discover the peculiar pattern in the first graph of this article.
If we plotted a similar curve to the one above for all the different leading digits, we would get something like this:

We can see that as we go up the leading digits, we have a lower and lower chance of picking it. Poor number 9 has a one-ninth chance at best, while number 1 has a one-ninth chance at worst! How not to rig an election
So what does this have to do with rigging elections again? The reason all of this matters in the real world is that unless they are very carefully prepared, fabricated numbers don’t tend to obey Benford’s Law — they don’t show this frequency pattern in their leading digits. This gives us a tool to detect figures that have been faked in an attempt to deceive people.. Here’s a few examples:
- Forensic accountants and auditors use Benford’s law to detect fraud in socio-economic figures. Data from accounting scandals in the past have been found to not hold up under this rule.
- In 2004, the Greek government admitted to faking economic data to join the European currency union. The fraudulent nature of this data can be recognised from its violation of Benford’s Law.
- In the 2009 elections in Iran, the number of votes for one candidate in the country’s different electoral districts did not follow Benford’s Law. In fact, there were too many numbers beginning with a 7. This anomaly occurred in three of the six biggest voting areas.
It is worth mentioning that Benford’s rule alone is not sufficient to prove whether a set of figures have been faked — like any statistical analysis, it can only tell us that they are unlikely to be genuine. Despite this caveat, what appears at first to be an amusing and harmless mathematical rule turns out to be a powerful and useful tool for identifying and preventing criminal and fraudulent practices.
And if you’re reading this from a jail cell because you got caught out telling porky pies in your tax return by a particularly numerically-inclined detective — better luck next time.
More info and credits
Andrew Hetherington is an actuary and data enthusiast working in London, UK. All views are Andrew’s own and not those of his employer.
- Connect with me on LinkedIn.
- See what I’m tinkering with on GitHub.
- The notebook used to produce the work in this article can be found here.
Images: Big Ben photo by Daniel H. Tong on Unsplash.
Countries population data from Worldometer. Accessed 16 May 2020.